1841-1939 Census Data – What We Found Out
We have carried out a project to collate the census data available on-line from 1841 to 1939 and provide this data in an easily accessible form centred on the properties in East Worlington. This data is available via the Property Map which provides a list of the occupants in all the properties in the parish between 1841 and 1921 and most of the occupants in 1939 as well as some information on a selection of properties. A separate project was undertaken to provide a list of people’s occupations and this can be found in the following table.
In collecting this information it soon became obvious that we could go beyond the occupation of individual properties to look at Worlington as a whole and below are some features of this data that show both the changing make-up of the population of Worlington over nearly one hundred years and some things that have stayed very much the same. For comparison the summary of the 2021 data from the UK Office for National Statistics has also been included.
Population Changes
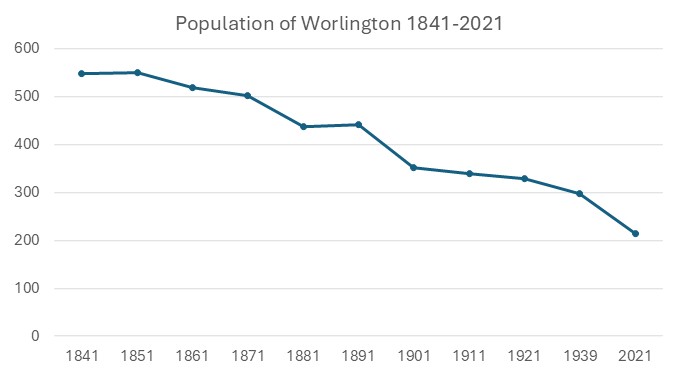
One of the more obvious changes over the time period 1841 to present day is the reduction in the number of people in the parish. Apart from two anomalies in 1851 and 1891 each census year shows a reduction in the number of people. In 1841 the population of the parish was 530 and the population estimate in 2021 was 215 which is 40%, or well under half, of the 1841 figure.
The animated graphic below shows the changing population from 1841 to 1939 in five age categories: infants under one year and ages 1-25, 26-50, 51-75 and 76 and over. Also included are figures for 2021 obtained from the most recent census.
The biggest change, as can be seen from the animation above and the graph below, is in the decline in the number of young people under the age of 25; which, post1911, is accompanied with an increase in the number of people over the age of 50.
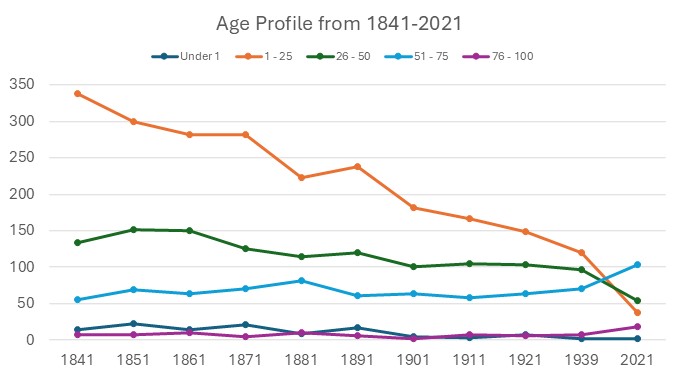
From this you won’t be surprised to know that the average age in the parish has consequently increased from a youthful 25 in 1841 to a slightly more mature figure of 49 in 2021.
Men and Women – Boys and Girls
Since census records started in 1841 there is one thing that has not changed and that is that men and boys have outnumbered women and girls in East Worlington on every census date.
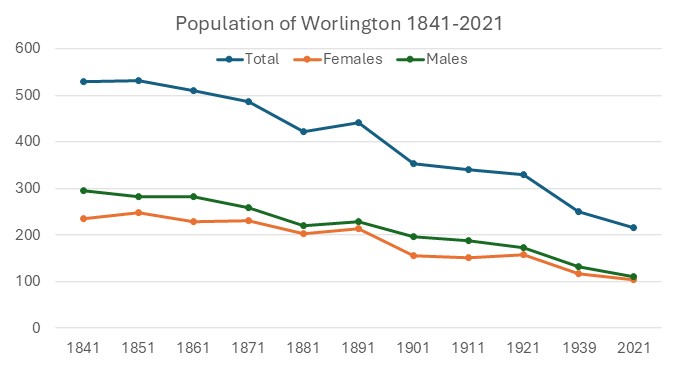
The current gap is now quite small and perhaps by 2031 we may be looking at equal numbers, but this does make East Worlington a bit of an anomaly, as in the UK as whole over this time period women have consistently been in the majority. In fact in the mid-19th century, there was such a large imbalance that the excess has been referred to as “surplus women”.
World wars in the 20th century also caused temporary drops in the male population but apparently this did not have a significant effect on East Worlington’s gender ratio. In the UK as a whole, women today still outnumber men by a narrow margin : 51% women and 49% men – but not yet in East Worlington.
Twins
Currently in the UK roughly 1 in 60 births result in twins. Estimates for the 19th and early 20th centuries are slightly higher with twin births as high as 1 in 37. Ten pairs of twins have been found in the Worlington census data. These are:
| Name | Born in | Age in census | Living in | |
| Thomas and William | Adams | 1826 | 15 | Lower Blagrove Farm |
| Elizabeth and William | Cann | 1835 | 16 | Cuddenhay |
| George and Mary | Lee | 1838 | 3 | Woodpark Cottage |
| Ann and William | Lee | 1841 | 1mth & 9 | Woodpark Cottage |
| John and Luke | Lee | 1850 | 1 | Woodpark Cottage |
| Sarah and William | Leach | 1855 | 6 | Beech Cottage |
| James and Laura | Adams | 1860 | 1 | Knights Cottage |
| Bessie and Mary | Beer | 1872 | 9 | Keepers Lodge |
| Emily and James | Crocker | 1877 | 4 | Milltown Cottage |
| Annie and Rosa | Hodge | 1912 | 9 | Stucley Arms Cottage |
And yes, all those Lee’s were born to the same parents. William and Sarah Lee, who appear in the 1841 and 1851 censuses, had three sets of twins and at least three other children. So it is perhaps no wonder that by 1841 the older twins, George and Mary, though only 13 are living elsewhere and working as a farm labourer and house servant.
Employment
Occupation was recorded on all the census records, though much of this data is missing for the 1841 census. However, there was no consistency of naming of occupations, so an attempt has been made to summarise the census data into employment sectors. Women were underrepresented in this data because wives were rarely assigned an occupation. So for the purposes of the summary all working age wives were allocated to the domestic sector. From the graph below it can be seen that agriculture and domestic work have been the dominant occupations for residents of Worlington.
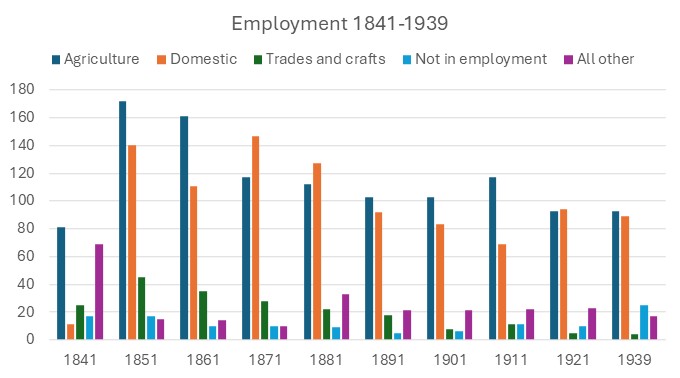
Some occupations present in the early census data later disappear completely from the records. In 1851 seven women have Glover as their occupation, but no-one in 1861 has this occupation and just one final resident in 1871. Similarly in the 19th century there are 31 records of shoemakers in East Worlington, with as many as eight people at the same time (1851 and 1861) working in this trade. Whereas only two people are recorded as being a Shoemaker in the 20th century and one of those is also the Postman.
Notable unusual occupations were John Mudge, a Master Mariner in 1851 and Luke Hosegood in 1891 who is recorded as a Hotel Manager. Twenty residents were recorded as being paupers, but interestingly only one of these, William Edworthy in 1851, was living in the Poor House. Sarah Veysey is one of the few women who have an occupation in the 1841 census. She is recorded as being a Messenger which according to the Postal Museum Website is an historical job title for Letter Carrier or Postman (or in this case Postwoman).
Number of Properties
It is difficult to determine accurately from the census data the number of properties in the parish. The main reasons for this are that unoccupied properties were not always recorded in the census data and where two households shared the same property this was rarely clearly indicated. Another hindrance is that many of the village cottages have either changed their names over time or were simply recorded as something like ‘cottage in village’, thus making it difficult to track occupancy from year to year.
Given the above caveats we can still make some make some estimates about the number of properties and how many people there were living in them. There were, we believe, 75 occupied properties in the parish in 1841 and this figure did not vary greatly between 1841 and 1939, with a low of 70 in 1911 and a slight increase to 81 in both 1861 and 1871. This contrasts with the current 113 properties in the parish based on the Post Code listing.

Household Size
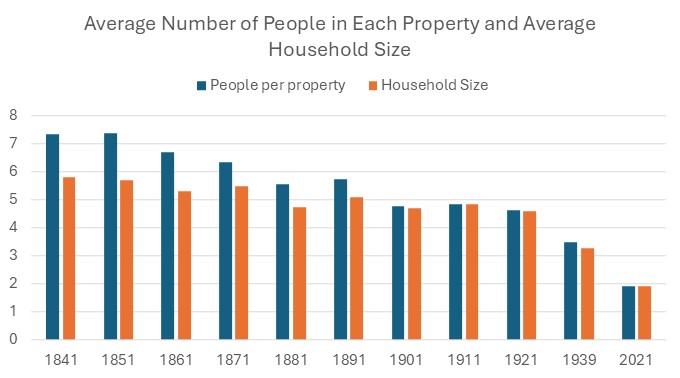
In 1841 the 530 people in the census were listed as 91 different households or family units. This means there was an average of nearly 6 people in each household. However, this does not mean that there were 6 people in each property as these 91 households were housed in just 75 properties. It is only in 1911 and again in the modern day that we find a one-to-one relationship between properties and households.

In 1841 there was an average of 7.4 people per property, compare this to the current 1.9 people per property and so we can imagine that life at home was a bit more cosy in past times.
Family Names
One thing that is very apparent as you browse through the East Worlington census data is that there are some family names that appear throughout, some of which are still in the parish today. Names such as: Adams, Boundy, Butt, Hosegood, Lake, Lee, Smyth, Troake and Yendell all appear in every census and through to the 1939 register. The most frequent of these was the Hosegoods who make 151 appearances in the records.
While some families endured others declined in numbers over time. Adams, the most common surname in 1841 with 25 residents in seven households, is reduced to just five members of the same family in 1921. The Edworthys who appear 134 times in the census records and had 27 residents in 1861 disappeared entirely by 1939. Greenslade too was a very common surname appearing 96 times, but this name disappears before 1911.
Below are the most common surnames in each census.
The vast majority of names only appear in one census, they come and they go, reflecting an ever changing population. Indeed, it was quite rare to find the same family in the same property in consecutive censuses and even rarer for them to be there for three or more censuses in a row. Exceptions to this were William and Annie Yendell who lived in what is now called the Old Post Office in East Worlington for a total of seven census years from 1871 to 1921. Another person who made seven appearances was George Smyth who lived in Town Barton from 1861 to 1939 – though there is a mysterious gap in 1911 when he doesn’t show up anywhere in East Worlington. Two William Hosegoods also appear seven times and also lived at the same time 1861-1921 (one was six years older than the other), one William lived at Cobley Farm throughout this time and the other at Cuddenhay Farm.
The Boundy’s are another old Worlington family and are noteworthy because there was a Boundy living in what was then called the Post Office (now Oak Ash and Thorn) from the first census in 1841 right through to the 1939 Register. Another property that has been in the same family since 1841 is Town Barton which is home to the Smyths to this day.
Finally, George Lee gets the prize for appearing in the most census records with eight mentions between 1851 and 1921. George spent most of his life on Deneridge Farm but moved on after his retirement.
In total there are 472 unique surnames in the census records, 199 of which only appear once.
First Names
There are 165 unique female first names in the census data. Mary is the most common female name with 1 in 6 with this name. Mary also tops out the female names lists in nine of the ten years. Mary shares the top slot with Elizabeth, Annie and Ellen in 1921 and drops out of the top five entirely in 1939. Whilst Mary accounts for a remarkable 25% of the female names in the 1841 Census, only 3% of the women or girls in the 1939 Register are called Mary. Interestingly Olive tops the list in 1939 along with Elizabeth, and Ellen despite Olive only ever appearing twice before, both times in 1911.
Below are the most popular female names in each census.
Following Mary in overall popularity across the census years is Elizabeth then Ann and Sarah. These four are incredibly common, together accounting for 41% of all the female names in the records. These four plus the next three common names: Jane, Ellen and Emily altogether make up over 50% of the female names. Like Mary these names have their peak and then decline but this is also a reflection on the increase in diversity of names. All the 247 females in the 1841 census share just 33 names and the top 5 names for that year (Mary, Elizabeth, Ann, Sarah and Jane) account for 74% of the total. Compare this to 1939 where 118 women and girls share 67 names and the top 5 are only 19% of these.

Some names are surprisingly uncommon: Ruth and Sophie are one-hit wonders appearing in only one census record. However, it is less surprising that names like Albertina, Ethelwyn, Lenetta and Wilmot also appear only once.
Like the women, the men are dominated by a small number of names. John and William are the most popular and share the top slots with each having 18% of the census records. This means that over a third of the men or boys are called either John or William and the top five names (William, John, George, Thomas and Samuel) account for over 50% of the records.
Below are the most popular male names in each census.
John and William, though declining in popularity after 1881, are still shared by 18% of the men and boys in the parish in 1939. Reginald jumps into the top 5 in 1939 with seven people called this, despite only just making the top 20 in 1921 and not appearing at all before 1901.
Despite there being more men than women in the census records, there are fewer unique male names with 114 overall compared to 166 for females.

As with the female names there are some names that are surprisingly infrequent: David, Michael and Simon appear only once. Some of the more unusual names are: Alwyne, Ephraim, Stafford and Sylvanus.
The UK census is taken every ten years and provides a snapshot into the life of people in the past on the day the census was taken. The censuses include details such as location, age, marital status and occupation for all the occupants at the same address. The data used in this project were the UK published censuses from 1841 to 1921 as well as the census-like information gathered at the start of WW2, which is known as the 1939 Register.
The online sources used were
![]()
and
![]()
The UK Office for National Statistics uses socially homogeneous geographical areas (called Output Areas) containing between 40–250 households and 100–625 residents in order to report summary data while maintaining confidentiality. These OAs then mapped onto parish boundaries on a best-fit basis.
The population in the 1841 census is actually 549 but this includes a disjoint area (Yeatheridge) that, since the civil parish boundary changes in 1885, have been part of Witheridge. The population in this area has been subtracted from the censuses between 1841 and 1881 in the following graphs. Devon’s Old Parish Boundaries has information on Devon’s parish boundary changes.
A household is a person, or group of people living at the same address. Today this is most commonly a family unit, but in the 19th century many households contained domestic servants or other unrelated workers living at the address. It was also more common for children to be living with relatives than it is perhaps today.